![24+ Important Distribution KPIs for Companies in [2024]](http://solid-innovation.com/cdn/shop/articles/news-distribution-kpis_00635d7b-71e7-476e-aaa4-16ab55b0ce8c.webp?v=1715184518&width=1650)
With technological advancements and changes in consumer behaviour, businesses must seek innovative methods to continuously refine their distribution strategies. The key to achieving peak efficiency and maximizing profitability is identifying and tracking the right Key Performance Indicators (KPIs).
However, with the vast array of distribution KPIs available, it can become challenging to determine which are essential for sharpening your operations and propelling your business forward. Well, don’t worry—this guide delves into the 24 essential distribution KPIs every company needs to monitor, providing insights to elevate your distribution process.
In this article, we’ll explore:
-
The most critical KPIs for the distribution industry today
-
Strategies and best practices to enhance your distribution KPIs
-
The latest tools and software for effective KPI tracking and analysis
P.S., Are you struggling to pinpoint the metrics that can propel your business forward? Solid Innovation® can help you out. Our route accounting software streamlines KPI monitoring, including distribution metric measures like order accuracy, inventory turnover, and customer satisfaction, and integrates effortlessly with QuickBooks, Sage 100, and SYSPRO. This guarantees that your financial performance and operational KPIs are consistently aligned. Benefit from our 35-day Full Access Trial Offer Today!
What are the Most Important Distribution KPIs for Companies? (A Quick Answer)
Companies' key distribution KPIs include order accuracy, inventory turnover, customer satisfaction, delivery timeliness, and route efficiency. These metrics crucially impact operational success and customer fulfillment. While these provide a foundation, delving deeper into each can unveil strategies for significant improvement and optimization.
What are Distribution KPIs?
Distribution Key Performance Indicators (KPIs) are metrics used to assess, measure, and track the efficiency and effectiveness of a distribution network. These KPIs typically focus on various aspects of the distribution process, such as
-
Inventory accuracy and management
-
Order fulfillment
-
Shipping accuracy
-
Fleet management
-
Delivery times
-
Logistics costs, etc.
By monitoring these indicators, businesses can evaluate and identify areas for improvement and make informed decisions to optimize their distribution and supply chain operations. These KPIs are essential for ensuring customer satisfaction, reducing costs, and improving overall operational efficiency.

24 Essential Distribution KPIs for 2024
As we look ahead to 2024, companies need to identify and monitor the key metrics that will drive success in their distribution strategies. Here are 24 essential distribution KPIs to keep in mind for 2024:
Operational KPIs for the Distribution Industry
These KPIs focus on the efficiency, effectiveness, and overall performance of distribution operations.
1. Order Accuracy
The Order Accuracy KPI measures the accuracy of order fulfillment in distribution centers or warehouses, assessing how often orders are completed correctly and according to customer specifications. This KPI is pivotal in ensuring customer satisfaction, minimizing returns, and maintaining operational efficiency.
Formula:
Order Accuracy(%) = (Total Number of Orders Fulfilled / Number of Orders Correctly Fulfilled) * 100
Strategies to enhance order accuracy, various strategies can be employed:
-
Implement Advanced Order Management Systems: Utilizing sophisticated software can streamline the process of order tracking, inventory management, and overall order processing. This can reduce human error and improve accuracy in fulfilling orders.
-
Solid Route Accounting™ is a leading distribution management software that enhances operational efficiency by integrating with ERP systems for real-time inventory tracking and order processing. It offers features like live customer order placements, advanced mobile sales, and optimized route planning.
-
Users benefit from detailed reports for strategic decisions, improved sales efficiency, and robust technical support. This results in notable business growth, increased inventory accuracy, and enhanced customer service.
-
-
Conduct Regular Audits: Regularly auditing order accuracy helps identify areas of improvement. Audits can reveal patterns or specific issues causing inaccuracies, allowing for targeted solutions.
-
Provide Training to Staff: It is crucial to ensure that all staff are well-trained and familiar with the processes and technology involved in order fulfillment. Training enhances skill levels and awareness, leading to fewer mistakes.
Best Practices to further improve order accuracy, consider these effective methods:
-
Use Barcode Scanning: Implementing barcode scanning for inventory tracking and order processing can significantly reduce errors. This technology ensures that the right products are picked and packed for each order.
-
Automate Data Entry: By automating data entry, human error is minimized. Automated systems can update inventory levels, process orders, and generate shipping labels more accurately than manual processes.
-
Establish a Double-Check System: Double-checking orders before dispatch can catch errors that might go unnoticed. This practice adds a layer of verification to the order fulfillment process.
2. On-Time Delivery (OTD)
On-Time Delivery (OTD) measures the success rate of delivering orders to customers within the promised time frame. High OTD rates often indicate efficient logistics, good inventory management, and strong supplier relationships, leading to higher customer satisfaction.
Formula:
OTD Rate = (Successful Deliveries / Total Number of Orders Delivered On Time) * 100
Strategies to improve On-Time Delivery rates include:
-
Enhance Logistics Planning: Effective logistics operations planning, including transportation and delivery schedules, can significantly increase the likelihood of on-time deliveries.
-
Improve Inventory Management: Having the right products in stock and ready for dispatch is essential for timely delivery. Effective inventory management ensures that products are available when orders are placed.
-
Implement Partial Deliveries: When full order fulfillment is at risk due to stock issues or other constraints, offering partial deliveries can maintain the flow of goods to your customers. This strategy can help preserve customer satisfaction levels, even when facing inventory challenges.
Best Practices to achieve high OTD rates:
-
Use Predictive Analytics for Traffic and Weather: Employing advanced analytics to predict traffic conditions and weather can help plan the most efficient delivery routes and schedules.
-
Maintain Buffer Stocks: Keeping a reserve of frequently ordered products can help to meet unexpected demand spikes or supply chain issues, ensuring that customer orders can still be fulfilled on time.
-
Ensure Clear Communication Channels: Effective communication within and with external partners (suppliers and carriers) is crucial for coordinating and executing timely deliveries.
3. Total Order Cycle Time (TOCT)
Total Order Cycle Time (TOCT) KPI is important in logistics and supply chain management. It measures the time taken from the moment a customer places an order until the order is delivered. Minimizing TOCT is crucial for customer satisfaction and operational efficiency.
Formula:
TOCT= (Delivery date – Order date) / Total number of orders shipped.
Strategies to reduce Total Order Cycle Time:
-
Speed up Order Processing: Simplifying and speeding up the order processing procedure, including order entry, picking, packing, and dispatching, can significantly reduce the overall order cycle time.
-
Enhance Supply Chain Coordination: Streamlining communication and coordination between all supply chain stakeholders, from suppliers to logistics providers, ensures faster and smoother deliveries.
-
Optimize Logistics Operations: Efficient logistics operations, including transportation and warehouse management, reduce delays and shorten the order cycle time.
Best Practices to manage Total Order Cycle Time efficiently:
-
Automate Order Processing: Automating the order processing steps can drastically reduce manual handling time, leading to quicker order fulfillment.
-
Improve Inter-Departmental Communication: To prevent delays caused by miscommunication or lack of information, all departments involved in the order process should communicate effectively.
-
Utilize Real-Time Tracking: Tracking orders and inventory in real-time allows for immediate response to any delays or issues in the order cycle, enabling faster delivery and resolution.
4. Inventory Turnover Rate
Inventory Turnover Rate is another crucial KPI in distribution. It indicates how often a company's inventory is sold and replaced over a specific period. A higher turnover rate suggests efficient inventory management, reflecting good sales performance and optimal stocking.
Formula:
Average Inventory = (Inventory at Period Start+Inventory at Period End) / 2
Strategies to enhance the Inventory Turnover Rate, adopt these strategies:
-
Optimize Stock Levels: Maintaining an optimal stock level prevents overstocking or stockouts, ensuring a steady flow of goods.
-
Improve Demand Forecasting: Accurate product demand predictions help maintain appropriate inventory levels, avoiding excess or insufficient stock.
-
Streamline Supply Chain Processes: Efficient supply chain operations ensure timely inventory replenishment, aligning it with sales patterns.
Best Practices to further improve the Inventory Turnover Rate, consider these best practices:
-
Regular Inventory Audits: Frequent checks and balances of inventory help identify issues like overstocking or understocking and enable timely corrective actions.
-
Using Dynamic Inventory Management Software: Such software can provide real-time insights into inventory levels' demand patterns and help make informed stocking decisions.
-
Close Collaboration with Suppliers: Working closely with suppliers ensures timely inventory replenishment and can help adapt quickly to changes in demand.
5. Return Rate and Management Efficiency KPI
The Return Rate and Management Efficiency KPI measures the frequency of returns and the efficiency of the return process. A lower return rate often indicates higher product quality and customer satisfaction, while efficient management reflects the company's ability to handle returns without excessive cost or time delays.
Formula:
While there isn't a single formula for "Management Efficiency" in the context of returns, businesses often assess this using the given formula.
Return Rate(%) = (Total Number of Items Sold / Number of Items Returned) * 100
Strategies to optimize the Return Rate and Management Efficiency these strategies can be effective:
-
Develop a Robust Returns Management Process: Establishing a structured process for handling returns ensures efficiency and consistency. This includes clear procedures for receiving, inspecting, and processing returned items.
-
Streamline the Return Logistics: Make the process of returning products easier and less costly, maybe by setting up specific returns centers or simplifying shipping.
-
Implement Quality Control Measures: Use quality checks at different stages in the product's life to greatly lower the chances of faults and returns.
Best Practices to further improve in this area, consider these best practices:
-
Use a Comprehensive Returns Management System: Implementing a dedicated system to manage returns can automate many aspects of the process, from generating return labels to tracking returned items through the supply chain.
-
Provide Clear Return Policies to Customers: Transparency in return policies can enhance customer trust and satisfaction. Clear, easily accessible return policies ensure customers understand the process, reducing confusion and potential dissatisfaction.
-
Analyze Return Data for Continuous Improvement: Regular return data analysis helps identify common reasons for returns. Understanding these patterns can improve product quality, packaging, shipping methods, or customer communication, ultimately reducing the return rate.
6. Transit Time to Distance
Transit Time to Distance is a Key Performance Indicator (KPI) that measures the efficiency of transportation operations. It precisely measures how long it takes for goods to be transported over a certain distance. Minimizing transit time relative to distance is crucial for timely deliveries and efficient logistics.
Formula:
Transit time to distance = (Time to go From Pickup to Destination) / (Total Distance Covered)
Strategies to make transportation more efficient over various distances:
-
Identify Quickest and Most Efficient Routes: Utilizing route optimization software or methods can identify the quickest and most efficient paths for transportation, reducing travel time for a given distance.
-
Leverage Efficient Transportation Modes: Choosing the most efficient mode of transportation for the distance and type of goods can significantly affect transit time. This could involve selecting air, road, rail, or sea transport based on speed, cost, and suitability.
-
Minimize Delays: Proactively managing factors that could cause delays, such as traffic, weather conditions, or customs clearance, can help maintain a steady transit time.
Best Practices for efficiently managing Transit Time to Distance:
-
Use GPS Tracking: GPS tracking enables real-time monitoring of transport vehicles. It allows for immediate adjustments in case of delays or route changes and ensures the most efficient path is followed.
-
Analyze Transit Data for Optimization: Regular analysis of transit times and conditions can provide insights into patterns and potential areas for improvement. This allows for data-driven decision-making to optimize routes and times.
-
Maintain Flexible Transportation Plans: Adapting transportation plans to changing conditions, such as rerouting in case of unexpected delays, can help maintain optimal transit times.
7. Receiving Cycle Time
The Receiving Cycle Time Distribution KPI provides insights into the efficiency of the inbound logistics process by measuring the time taken for goods or materials to be received after they are ordered. It reflects the effectiveness of the receiving operations within a supply chain or logistics operation.
Optimizing this KPI is essential for ensuring the timely availability of inventory and minimizing delays in production or order fulfillment.
Formula:
Receiving Cycle Time = Total Time to Process Received Goods / Total Number of Shipments Received
Strategies that can significantly enhance the efficiency of receiving cycle time distribution:
-
Streamline Receiving Processes: Identify and eliminate bottlenecks in the receiving process to reduce cycle times. This can involve automating manual tasks, improving communication with suppliers, and implementing efficient handling procedures.
-
Implement Just-in-Time Inventory Management: By synchronizing incoming shipments with production schedules, organizations can minimize the time goods spend in receiving, thereby reducing cycle times and inventory holding costs.
-
Enhance Supplier Collaboration: Work closely with suppliers to improve lead times, order accuracy, and delivery reliability. Establishing strong relationships and clear communication channels can facilitate faster receiving times and reduce cycle time variability.
Best Practices that can further optimize the receiving process and ensure consistent improvements in cycle time distribution:
-
Utilize Advanced Tracking Technologies: Implementing RFID, barcoding, or other tracking technologies can provide real-time visibility into incoming shipments, enabling proactive management of receiving processes and reducing cycle times.
-
Optimize Receiving Workflows: Standardize receiving procedures and layout to minimize unnecessary movement and maximize efficiency. This can involve optimizing storage locations, batch processing similar items, and cross-training receiving personnel.
-
Continuous Improvement: Regularly analyze receiving cycle time data to identify trends, root causes of delays, and opportunities for improvement. Implementing continuous improvement initiatives ensures receiving processes remain efficient and adaptable to changing business requirements.
8. Back Order Rate
The Back Order Rate measures the frequency at which customer orders cannot be fulfilled from current stock and must be placed on backorder. A high back order rate can signal potential issues in demand forecasting, supplier performance, or inventory management practices, directly impacting customer satisfaction and company reputation.
Formula:
Back Order Rate(%) = (Number of Undeliverable Orders / Total Number of Items Ordered) * 100
Strategies for reducing Back Order Rates and enhancing customer satisfaction:
-
Improve Inventory Management: Effective inventory management ensures that products are available when needed. This involves regular monitoring of stock levels and timely replenishment to prevent shortages.
-
Enhance Demand Forecasting: Businesses can anticipate what products will be popular to stock up on inventory and meet customer demand. By having the right products available when customers want them, they can avoid potential backorders and ensure customer satisfaction.
-
Maintain Strong Supplier Relationships: Strong relationships with suppliers can ensure timely and reliable restocking, which is critical in minimizing backorders.
Best Practices to minimize the Back Order Rate and improve operational efficiency:
-
Maintain Safety Stock: Keeping a buffer stock for high-demand or critical items can prevent stockouts and reduce the need for backorders.
-
Use Backorder Management Software: Such software can help efficiently manage backorders, track pending orders, and provide visibility to the business and the customer.
-
Regularly Communicate with Customers: Open communication about backorder status, expected fulfillment times, and alternative options can maintain customer trust and satisfaction even when facing stock issues.
9. Labour and Equipment Utilization
Labour and Equipment Utilization KPIs focus on maximizing the efficiency and productivity of both human resources and machinery within a business. Proper utilization ensures optimal performance, cost-effectiveness, and equipment longevity.
Formula:
Equipment Utilization Rate(%) = (Actual Operating Hours / Maximum Possible Operating Hours) * 100
Strategies to maximize Labor and Equipment Utilization:
-
Ensure optimal workforce scheduling: Efficiently scheduling the workforce to align with operational demands ensures that labour resources are utilized effectively, avoiding understaffing and overstaffing.
-
Maintain Equipment Efficiency: Regular maintenance and timely equipment upgrades keep them running optimally, reducing downtime and extending their useful life.
-
Implement Continuous Improvement Programs: Encouraging a culture of continuous improvement, where employees are motivated to suggest and implement efficiency enhancements, can lead to better utilization of labour and equipment.
Best Practices to ensure optimal performance of labour and equipment:
-
Regular Utilization Reviews: Periodic assessments of how labour and equipment are used can identify inefficiencies and areas for improvement.
-
Invest in Training and Maintenance: Training employees to improve their skills and ensuring regular equipment maintenance helps maximize their productivity and efficiency.
-
Use of Labor and Equipment Tracking Tools: Implementing tools and systems to track labor productivity and equipment usage can provide valuable data. This data can then be used to make informed resource allocation and utilization decisions.
10. Demand Forecasting Accuracy KPIs
Demand Forecasting Accuracy evaluates how well a business can predict future sales. Accurate forecasting enables distributors to gauge the precision of their demand predictions, directly influencing their ability to manage inventory efficiently, optimize logistics, and meet customer demands effectively.
Formula:
Forecast Accuracy(%) = (1 − Total Absolute Error / Total Actual Demand) * 100%
Strategies to enhance demand forecasting accuracy:
-
Leverage Advanced Analytics: Utilizing sophisticated analytical tools can help process large amounts of data to identify patterns and trends influencing demand.
-
Gather Market Intelligence: Staying informed about market trends, customer preferences, and industry changes helps predict future demand more accurately.
-
Improve Data Collection: Ensuring that the data collected is comprehensive, accurate, and timely can significantly enhance the quality of demand forecasts.
Best Practices for achieving more precise demand forecasts:
-
Use AI-based Forecasting Tools: Artificial Intelligence (AI) can analyze complex data sets and provide more accurate and nuanced demand forecasts than traditional methods.
-
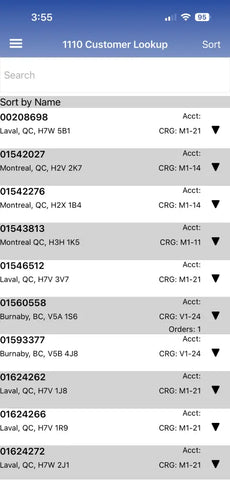
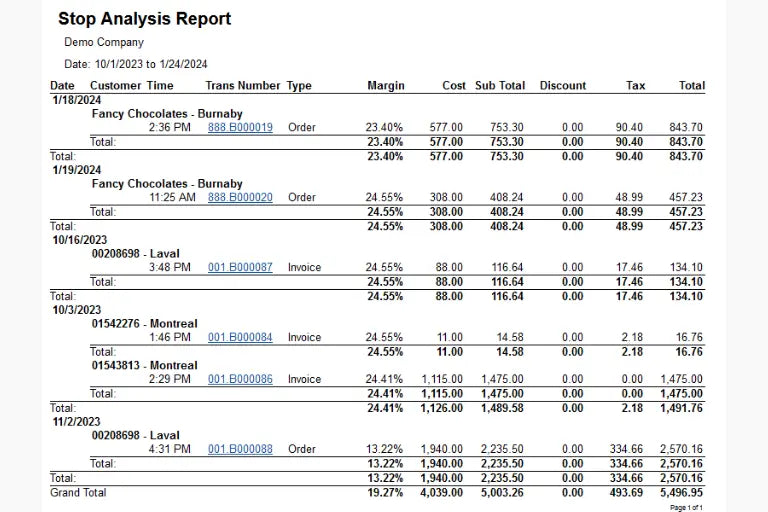
Tools like Solid Route Accounting™'s Stop Analysis Report and Trip Analysis Report can be used to gain insights into sales trends, customer behavior, and route efficiency. Understanding these metrics can inform dynamic strategies by identifying high-demand periods or locations, allowing businesses to adjust inventory accordingly.
-
-
Regularly Review Forecasting Models: Continuously evaluating and updating forecasting models ensures they remain relevant and accurate in a changing market environment.
-
Involve Cross-Functional Teams: Collaborating with different departments (like sales, marketing, and operations) in the forecasting process can provide a more complete view of demand influencers, leading to more accurate forecasts.
11. Supply Chain Visibility KPI
Supply Chain Visibility KPI involves tracking products from the point of origin to the final customer, ensuring transparency and efficiency at every stage. High visibility in the supply chain leads to better decision-making, reduced costs, and improved customer satisfaction.
Formula:
Inventory Visibility Accuracy = (Number of Accurate Inventory Records / Total Inventory Records Checked) * 100%
Strategies to enhance Supply Chain Visibility and improve efficiency:
-
Implement Advanced Tracking and Monitoring Systems: Using technologies like GPS, RFID tags, and IoT devices can provide real-time tracking of products and materials throughout the supply chain.
-
Integrate Supply Chain Partners into a Shared Platform: Establishing a digital platform where all supply chain partners can share and access information ensures a unified view of the supply chain, improving coordination and reducing delays.
-
Enhance Data Analytics Capabilities: Advanced data analytics can interpret large volumes of supply chain data, providing insights for better forecasting, risk management, and decision-making.
Best Practices to optimize Supply Chain Visibility for transparency and collaboration:
-
Utilize Real-Time Tracking Technologies: Real-time tracking enables immediate response to potential issues and provides up-to-date information on the location and status of goods.
-
Foster Transparent Communication Across the Supply Chain: Encouraging open and regular communication among all stakeholders in the supply chain enhances collaboration and timely resolution of issues.
-
Conduct Regular Audits to Identify and Address Visibility Gaps: Periodic supply chain assessments can identify areas lacking visibility, allowing for targeted improvements to enhance overall transparency.
12. Transportation Cost as a Percentage of Sales Order
Transportation Cost as a Percentage of Sales is a KPI that shows how much of a company's sales revenue is spent on transportation. The goal is to keep this percentage as low as possible without compromising the delivery quality.
Formula:
Transportation Cost as a Percentage of Sales Order(%) = (Total Transportation Costs / Total Revenue from Sales Orders) * 100
Strategies for reducing transportation costs relative to sales:
-
Optimize Route Planning: Efficient route planning is critical to reducing transportation costs. By strategically planning routes, companies can minimize the distance traveled, saving time and fuel. This involves analyzing delivery points and optimizing the order of stops to create the most efficient routes.
-
Consolidate Number of Shipments: Combining multiple smaller shipments into one larger shipment can significantly lower transportation costs. This practice not only reduces the number of trips required but also maximizes the utility of each trip. It's particularly effective for deliveries within the same geographical area.
-
Negotiate Better Carrier Rates: Negotiating with carriers can lead to more favorable shipping rates. Companies should regularly assess their shipping volume and leverage this data in negotiations to secure better terms. Building long-term relationships with carriers can also open doors to exclusive deals and discounts.
Best Practices to further enhance transportation efficiency:
-
Regularly Review Transportation Contracts: It's essential to reassess them to ensure they align with current market rates and company needs. This could involve renegotiating terms or exploring new carrier options for more cost-effective solutions.
-
Employ Fuel-Efficient Vehicles: Investing in fuel-efficient vehicles can lead to substantial cost savings in the long run. These vehicles consume less fuel, reducing the overall cost of transportation. Additionally, they contribute to a company’s sustainability goals.
-
Leverage Technology for Efficient Logistics: Using advanced software for route optimization, real-time tracking, and efficient load planning can significantly enhance transportation efficiency. This technology not only helps cut costs but also improves service quality.
13. Customer Complaints
Customer Complaints KPIs are a vital metric for understanding customer satisfaction and identifying areas for improvement in product quality and service. Managing and reducing customer complaints is crucial for maintaining a positive brand reputation and customer loyalty.
Formula:
Customer Complaints(Monthly/Quarterly/Yearly) = (Customer complaints about services or product quality / Total number of customer complaints) * 100.
Strategies to effectively handle and reduce customer complaints:
-
Enhance Customer Service: Providing exceptional customer service can often prevent issues from escalating into complaints. This involves being proactive, responsive, and empathetic in all customer interactions.
-
Implement Feedback Mechanisms: Establishing easy-to-use feedback channels allows customers to voice concerns or issues before they become formal complaints. This can include surveys, comment cards, or online feedback forms.
-
Streamline Complaint Resolution Processes: Developing efficient processes for handling complaints ensures they are addressed quickly and effectively, reducing customer frustration and the likelihood of repeat complaints.
Best Practices in managing customer complaints:
-
Regular Staff Training: Continuously training staff in customer service skills and complaint handling ensures they can deal with issues effectively and empathetically.
-
Real-Time Customer Support: Offering immediate assistance through channels like live chat, phone support, or social media can quickly resolve issues and prevent the escalation of complaints.
-
Thorough Analysis of Complaint Trends: Regularly reviewing and analyzing the nature and frequency of complaints can identify underlying issues or trends, guiding improvements in products, services, or processes.
Lean Distribution KPIs
Lean KPIs emphasize waste reduction, process efficiency, and continuous improvement, focusing on streamlining operations and enhancing productivity.
14. Employee Productivity KPI
Employee Productivity KPIs are vital for measuring the efficiency and effectiveness of a business's workforce. They reflect how well employees utilize their skills and time to contribute to the company's goals. Employee productivity can lead to better operational performance, higher-quality output, and increased profitability.
Formula:
Revenue per Employee = Total Revenue / Number of Employees
Strategies to optimize Employee Productivity KPIs:
-
Provide Training and Development: Offering employees opportunities to improve their skills and knowledge can lead to more efficient and effective work practices. This includes job-specific training, soft skills development, and continuous learning opportunities.
-
Invest in Productivity Tools: Utilizing tools and technologies that streamline workflows, automate repetitive tasks, and facilitate better communication can significantly boost productivity.
-
Create a Motivating Work Environment: Ensuring the work environment is positive, supportive, and engaging can motivate employees to perform at their best. This can involve recognizing achievements, offering competitive benefits, and ensuring a healthy work-life balance.
Best Practices in maximizing Employee Productivity:
-
Regular Performance Reviews: Conducting consistent and constructive performance evaluations helps employees understand their strengths and areas for improvement, setting a clear path for productivity enhancements.
-
Use of Labour Management Systems: Implementing systems that track and analyze employee performance and work patterns can identify areas for productivity improvement and help in workforce planning.
-
Set Clear Productivity Goals: Providing employees with specific, measurable, achievable, relevant, and time-bound (SMART) goals gives them a clear understanding of what is expected and how their performance will be measured.
15. Warehousing Costs KPI
Warehousing Costs KPIs are essential for measuring and controlling the expenses associated with warehouse operations, including third-party logistics. These KPIs help businesses understand how efficiently they use their warehousing resources and identify areas where costs can be reduced.
Formula:
Warehouse Operating Cost per Unit = Total Warehouse Operating Costs / Total Units Stored
Strategies to follow for managing warehouse costs efficiently:
-
Optimize Warehouse Operations: Streamlining warehouse processes, such as inventory management, picking, and packing, can lead to more efficient use of resources and reduced operational costs.
-
Implement Automation: Automation in warehousing, including robotics and conveyor systems, can significantly increase efficiency and reduce labor costs.
-
Regularly Review Facility Costs: Monitoring all operating costs associated with warehousing, including utilities, maintenance, and labor, will help identify and control unnecessary expenditures.
Best Practices for effective Warehouse Cost management:
-
Utilize Warehouse Management Systems (WMS): By using a WMS, you can better use space, organize inventory well, and make warehouse operations smoother, which can help save money.
-
Conduct Regular Cost-Benefit Analyses: Regular assessments of warehousing operations, comparing costs with the benefits, can identify areas where changes could lead to cost reductions.
-
Optimize Storage Solutions: Installing high-density storage systems or reconfiguring layouts can optimize warehouse storage capacity and minimize additional space costs.
16. Picking and Packing Cost
Picking and Packing Cost is a Key Performance Indicator (KPI) that measures the efficiency and cost-effectiveness of the processes involved in selecting and preparing items for shipping. Reducing these costs can significantly impact a company's gross profit margin and operational efficiency.
Formula:
Picking and Packing Cost = Total Cost of Picking and Packing / Total Number of Orders
Strategies for enhancing efficiency and cutting costs in Picking and Packing:
-
Automate Picking and Packing Processes: Implementing automation in the picking and packing processes, such as robotic systems or conveyor belts, can increase efficiency and reduce labor costs.
-
Optimize Warehouse Layout: Designing the warehouse layout to minimize the distance workers travel to pick items can reduce the time and labor involved in these processes.
-
Train Staff: Providing comprehensive training on efficient picking and packing methods can improve speed and accuracy, reducing the time and cost of these processes.
Best Practices to maximize cost-effectiveness in Picking and Packing:
-
Use of Warehouse Management Systems (WMS): Employing WMS can help efficiently organize and manage warehouse operations, leading to quicker and more cost-effective picking and packing processes.
-
Continuous Process Improvement: Regularly reviewing and refining picking and packing processes can lead to ongoing efficiency and cost reduction improvements.
-
Cost Analysis: Conducting detailed cost analyses of the picking and packing processes can help identify areas where expenses, such as materials, labor, or overhead costs, can be reduced.
17. Transportation Costs KPI
Transportation Costs KPIs are important for businesses that rely on shipping and logistics, as they measure the expenses related to the transportation of goods. Effective management of these costs is vital for maintaining profitability and competitiveness.
Formula:
Transportation Costs KPI = Total transportation costs / Total units shipped
Strategies to help businesses optimize transportation costs:
-
Optimize Fleet Utilization: Ensuring that each vehicle is used efficiently, with full loads and optimized routes, can significantly reduce transportation costs per unit.
-
Negotiate Better Shipping Rates: Regular negotiations with carriers for more favorable rates can lead to substantial cost savings, especially for businesses with large shipping volumes.
-
Employ Fuel-Efficient Transportation Methods: Using vehicles that consume less fuel or alternative fuels can reduce fuel costs, a significant component of transportation expenses.
Best Practices for effective management of transportation expenses:
-
Regular Cost Analysis: Continuously analyzing transportation costs helps identify trends, inefficiencies, and areas where savings are possible.
-
Use of Transportation Management Systems (TMS): These systems can optimize route planning, load scheduling, and carrier selection, leading to more efficient transportation operations and cost savings.
-
Exploration of Alternative Transport Modes: Considering different modes of transportation, such as rail, sea, or air, depending on the nature of the goods and delivery requirements, can offer cost advantages in specific scenarios.
18. Fuel Economy Per Vehicle
Fuel Economy Per Vehicle measures how efficiently a vehicle uses fuel, directly impacting operational costs and environmental footprint. Improving fuel economy is crucial for cost savings and sustainability.
Formula:
Fuel Economy Per Vehicle = Total Distance Traveled by all Vehicles / Total Fuel Consumed by all Vehicles.
Strategies to enhance Fuel Economy Per Vehicle and reduce operational costs:
-
Use Fuel-Efficient Vehicles: Investing in vehicles with better fuel efficiency can significantly save fuel consumption and costs.
-
Optimize Routes: Using route optimization tools to find the shortest and most efficient routes can reduce the distance traveled and fuel consumed.
-
Train Drivers in Eco-Friendly Driving Practices: Educating drivers on maintaining steady speeds, avoiding unnecessary idling, and efficient braking can improve fuel efficiency.
Best Practices to improve fuel efficiency and sustainability in vehicle operations:
-
Regular Vehicle Maintenance: Regular maintenance can keep vehicles in top condition and enhance their fuel efficiency. This includes checking and adjusting tire pressure, changing the oil on schedule, and ensuring engines run smoothly.
-
Monitoring Fuel Usage: Tracking fuel consumption for each vehicle can help identify issues or trends related to fuel use, allowing for targeted actions to improve efficiency.
-
Investing in Alternative Fuel Vehicles: Exploring options like electric or hybrid vehicles can be a long-term strategy for improving fuel economy and reducing a fleet's environmental impact.
19. Carbon Footprint KPIs
Carbon Footprint KPIs focus on measuring the environmental impact of a company's operations, specifically its greenhouse gas emissions. Reducing the carbon footprint is crucial for sustainable business practices and corporate responsibility.
Formula:
Carbon Footprint = (Total Greenhouse Gas Emissions / Total Number of Employees) * 100
Strategies to reducing carbon footprint effectively:
-
Implement Green Logistics Practices: Adopting environmentally friendly logistics, such as using sustainable materials and reducing waste, can significantly lower a company's carbon footprint.
-
Use Eco-Friendly Packaging: Switching to packaging materials that are recyclable or biodegradable reduces environmental impact.
-
Optimize Transportation Routes: Efficient routing reduces fuel consumption and emissions from transportation.
Best Practices for managing carbon footprint efficiently:
-
Invest in Renewable Energy: Using renewable energy sources, like solar or wind power, for operations can drastically reduce carbon emissions.
-
Conduct Carbon Audits: Regularly assessing one's carbon footprint helps identify significant sources of emissions and areas for improvement.
-
Engage in Carbon Offset Programs: Participating in programs that compensate for emissions through activities like tree planting or investing in sustainable projects can help offset a company's carbon footprint.
Financial KPIs for the Distribution Industry
These KPIs assess the financial health and profitability of distribution operations, including costs, revenue, and investment returns.
20. Customer Retention Rate KPI
Customer Retention Rate KPIs are crucial for measuring how well a business maintains its customer base over time. High customer retention rates indicate customer satisfaction and loyalty, which are essential for business success and sales growth.
Formula:
Customer Retention Rate (%) = (Customer End of Period - Customer Acquired During Period) / Customer Start of Period) * 100
Strategies to enhance Customer Retention Rate and foster loyalty:
-
Deliver Exceptional Customer Service: Providing top-notch service is key to retaining customers. This includes addressing their needs promptly, resolving issues effectively, and going above and beyond to ensure customer satisfaction.
-
Understand Customer Needs: Continuously gathering and analyzing customer feedback and market trends helps understand and meet customer expectations, leading to increased satisfaction and loyalty.
-
Create Loyalty Programs: Implement loyalty programs that offer rewards, discounts, or other incentives to encourage customers to continue doing business with you.
Best Practices for maximizing customer satisfaction and loyalty:
-
Regular Customer Satisfaction Surveys: Conducting surveys regularly helps gather valuable feedback directly from customers, providing insights into their level of satisfaction and areas for improvement.
-
Personalized Marketing: Tailoring marketing efforts to individual customer preferences and behaviors can create a more personal connection. This helps increase the likelihood of customers staying engaged with the brand.
-
Responsive Customer Support: Ensuring customer support is easily accessible, efficient, and effective in resolving issues is crucial for maintaining customer trust and satisfaction. Responsive support helps to address concerns promptly and enhance the overall customer experience.
21. Vendor Performance KPI
Vendor Performance KPI is crucial for assessing the effectiveness and reliability of suppliers in a supply chain. This KPI helps ensure vendors meet the required standards and contribute positively to the business's operations. Here are some key Vendor Performance KPIs:
Formulas:
-
Quality performance = (Number of defect-free deliveries / Total number of deliveries) * 100
-
Cost performance = (Actual cost incurred / Budgeted cost) * 100
-
Communication performance = (Number of communication issues resolved on time / Total number of communication issues) * 100
-
Relationship performance = (Number of positive vendor feedback received / Total number of vendor interactions) * 100
Strategies for improving vendor performance:
-
Establish Clear Performance Criteria: Defining specific, measurable criteria for evaluating vendor performance ensures that expectations are clear and objective. This includes delivery times, product quality, and responsiveness to inquiries or issues.
-
Maintain Open Communication: Regular, transparent communication with vendors helps promptly address issues and facilitates a better understanding of expectations and requirements.
-
Foster Collaborative Relationships: Building a partnership approach with vendors, rather than a purely transactional relationship, can lead to improved performance. This involves working together to solve problems, share information, and identify opportunities for mutual benefit.
Best Practices to enhance vendor management effectiveness:
-
Regular Vendor Evaluations: Conducting periodic assessments of vendors against the established performance criteria helps identify areas of excellence and those needing improvement. It also informs vendors of their performance and the importance of meeting expectations.
-
Use of Vendor Management Systems: These systems provide a platform for tracking and managing vendor performance, facilitating more accessible analysis and comparing different vendors.
-
Set Mutual Performance Goals: Collaborating with vendors to set achievable and mutually beneficial performance goals can motivate vendors to improve their services and align their objectives with the businesses.
22. Days Sales of Inventory (DSI)
Days Sales of Inventory (DSI) is a Key Performance Indicator (KPI) that measures the average number of days it takes for a company to turn its entire inventory into sales. A lower DSI indicates that a company efficiently manages its inventory, sells it quickly, and reduces holding costs.
Formula:
Days Sales of Inventory = (Average Inventory ÷ Cost of Goods Sold) * 365
Strategies for reducing Days Sales of Inventory (DSI) and enhancing inventory management:
-
Improve Inventory Turnover Ratio: Enhancing the rate at which inventory is sold and replaced can decrease DSI. This can be achieved by implementing strategies to boost sales, such as marketing promotions or expanding distribution channels.
-
Optimize Stock Levels: Maintaining an optimal inventory level, low to incur excess holding costs or low to-risk stockouts, is crucial. This requires a balance between having enough stock to meet demand without overstocking.
-
Align Inventory with Demand Patterns: Understanding and responding to consumer demand patterns ensures inventory levels align with actual sales trends, preventing overstocking of slow-moving items.
Best Practices to manage inventory better and sell products quicker:
-
Regular Inventory Analysis: Consistently analyzing inventory levels and turnover rates helps identify slow-moving items and allows adjustments to reduce excess stock.
-
Just-in-Time Inventory Practices: Implementing just-in-time (JIT) inventory practices can significantly reduce inventory holding times, as stock is ordered and received as close as possible to the time it is needed for sale.
-
Close Monitoring of Sales Trends: Monitoring sales trends closely helps predict future demand more accurately, allowing for better inventory planning and management.
23. Gross Margin Return on Investment (GMROI)
The Gross Margin Return on Investment (GMROI) is a key financial metric used in the distribution sector to evaluate the profitability and efficiency of inventory investments. Essentially, GMROI helps businesses understand the return on their inventory investments, guiding decisions on buying, pricing, and inventory management to enhance net profit margin.
A high GMROI indicates that the company is effectively converting its inventory into cash above the cost of the inventory, whereas a low GMROI suggests inefficiencies that need addressing.
Formula:
GMROI = Gross Margin / Average Inventory Cost
Strategies to optimize your Gross Margin Return on Investment with these practices:
-
Optimize Inventory Levels: Keep inventory levels closely aligned with demand forecasts. Overstocking ties up capital and may lead to markdowns, while understocking can miss sales opportunities. Efficient inventory management maximizes turnover and gross margin.
-
Improve Purchase Terms: Negotiate better terms with suppliers, including lower prices, volume discounts, and extended payment terms. Reducing the cost of goods sold (COGS) directly improves GMROI by increasing the gross margin.
-
Enhance Product Mix: Focus on selling high-margin items or bundle products to encourage the sale of slower-moving items. Analyzing sales data to understand which products have the best margin and turnover rates can lead to a more profitable inventory assortment.
Best Practices in inventory and pricing management to transform your GMROI:
-
Regular Review of Product Performance: Continuously analyze product sales performance, identifying high and low performers. This enables timely decisions on markdowns, promotions, or discontinuing products, optimizing the inventory for better returns.
-
Implement Pricing Strategies: Use dynamic pricing strategies to adjust prices based on demand, competition, and market conditions. Pricing flexibility can improve gross margins and, consequently, GMROI.
-
Leverage Technology for Inventory Management: Employ inventory management systems that provide real-time data and analytics. These systems can help make informed purchasing decisions, forecast demand more accurately, and identify trends that affect GMROI.
24. Lost Sales
Lost Sales is a critical Key Performance Indicator (KPI) that measures potential sales that were not realized due to factors like stockouts, pricing issues, or inadequate customer service. Addressing the causes of lost sales is essential for revenue growth and customer satisfaction.
Formula:
Lost Sales = (Total Potential Sales - Actual Sales) x Selling Price
Strategies to reduce and understand lost sales:
-
Analyze Lost Sales Reasons: Investigate the reasons behind lost sales, such as why customers chose not to purchase or could not find the desired product. It is crucial to identify areas for improvement.
-
Improve Inventory Availability: Ensuring that popular and in-demand items are consistently in stock can significantly reduce the chances of lost sales due to inventory shortages.
-
Enhance Customer Engagement: Building stronger customer relationships through effective communication and engagement strategies can help them understand their needs better and reduce lost sales opportunities.
Best Practices for addressing lost sales are:
-
In-depth Market Analysis: Regularly analyzing market trends and consumer behaviour can provide insights into customer needs and preferences, helping to align offerings with market demand.
-
Regular Customer Feedback: Actively seeking and analyzing customer feedback can reveal unaddressed issues and preferences that might lead to lost sales.
-
Robust Demand Forecasting: Accurate demand forecasting helps maintain appropriate inventory levels. It also helps make informed decisions about product offerings, pricing, and promotions, reducing the likelihood of lost sales.
Software to Track and Analyze Distribution KPIs
An effective distribution KPI tracker software provides in-depth analysis and real-time data that can help managers make more informed decisions, optimize distribution channels, and ultimately drive business growth. Here are some popular options:
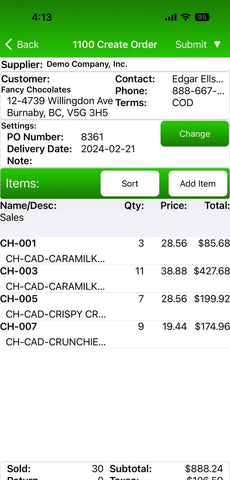
1. Solid Innovation®
For over 35 years, Solid Innovation® has been a leader in mobile sales and route accounting solutions. It's renowned as the #1 software for route accounting and B2B order taking, particularly in Direct Store Delivery (DSD). Their technology streamlines sales and accounting for small and medium businesses, making operations more efficient.
Key Features:
-
Robust Data Security: Hosted on a leading cloud computing platform for robust reliability and security measures, ensuring your data is stored and protected.
-
Integrated Accounting Tools: Seamlessly integrate with top accounting software to ensure accurate financial tracking and reporting.
-
Effortless ERP(Enterprise Resource Planning) Synchronization: Seamless integration with accounting/ERP systems like QuickBooks, Sage 100, and SYSPRO.
-
KPI Monitoring: It offers reliable, centrally managed KPI solutions for pre-sales, invoicing, inventory pricing, and customer management in distribution. This integration ensures high accuracy in route solutions.
-
Centralized Customer Management: Streamline customer interactions and route planning from one central hub.
-
Optimized Delivery Operations: With easy-to-use inventory and barcoding tools, manage all your delivery and sales routes from one place.
-
Compatibility: Modern handheld computers running on Android or iOS operating systems.
2. Geckoboard
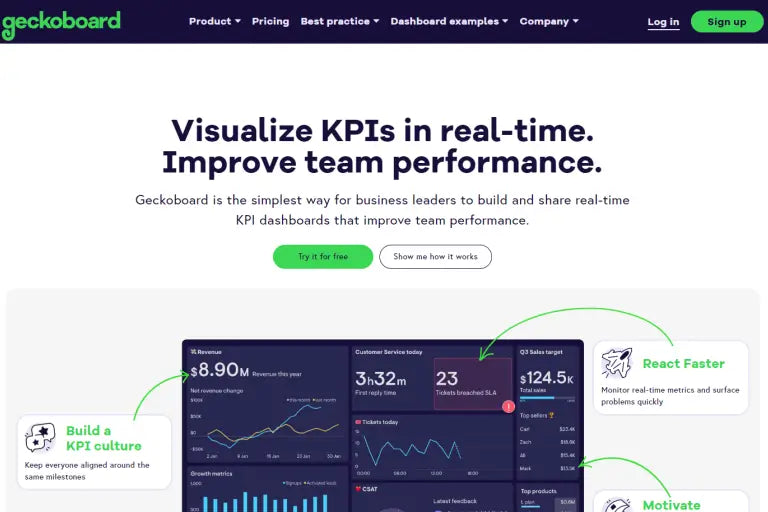
Geckoboard is a platform that allows you to visualize key performance indicators (KPIs) in real time, ultimately leading to improved team performance. Its Customer Support KPI Guide provides detailed formulas and definitions for the most important KPIs. This includes clear explanations of how each KPI is calculated and what it measures.
Key Features:
-
Instant KPI Visualization: Real-time visualization of Key Performance Indicators (KPIs) for improved team performance
-
Cultivate a KPI-Driven Team: Create a KPI culture within your team to keep everyone aligned around milestones.
-
Accelerate Response Times: Monitor real-time metrics and react faster to any issues that arise.
-
Extensive Data Integration: Connect to over 90 data sources to access real-time data easily
-
User-Friendly Design: Use a simple drag-and-drop interface to design customized dashboards
-
Flexible Dashboard Displays: Display KPI dashboards on TV, view them on mobile, or schedule snapshots for email and Slack sharing
-
Scheduled Insights: Geckoboard connects to popular business tools like spreadsheets and offers custom API integration options for other data sources.
3. KPI Fire
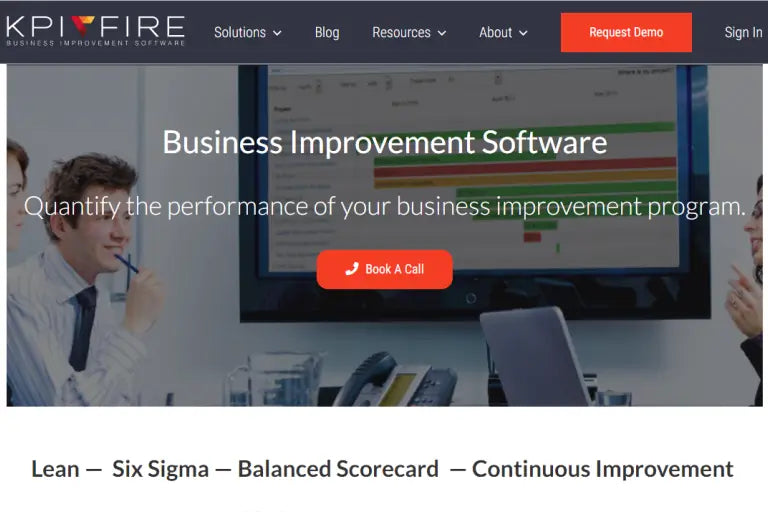
KPI Fire is a business improvement software that allows companies to align their strategies, focusing on Lean, Six Sigma, Balanced Scorecard, and Continuous Improvement. It helps execute strategies effectively by measuring the performance of projects and continuous improvement initiatives. The software provides a central platform for project and portfolio management, giving companies a single source of truth for their improvement program.
Key Features
-
Align Strategic Objectives: Align strategic objectives with key performance metrics for effective strategy execution.
-
Team Collaboration and KPI Alignment: Engage people through team collaboration, align individual KPIs with team goals, and track progress on public dashboards.
-
Cost Savings Identification: Quantify potential cost savings and identify projects needing assistance to deliver consistent savings.
-
Data Visualization and Operational Optimization: Visualize data in user-friendly dashboards to eliminate waste, boost production, and optimize operations.
-
Corporate Endorsement: Trusted by world-class companies for quantifying performance and improving business processes.
Enhance Your Distribution Strategy with Advanced KPI Tracking
Keeping a keen eye on Distribution KPIs is crucial for companies looking to streamline their distribution channels and adapt to the ever-evolving market conditions in 2024. By leveraging the right distribution metrics, businesses can ensure efficiency, customer satisfaction, and adaptability in their distribution strategies.
Key Takeaways:
-
Technological advancements necessitate the modernization of KPI tracking.
-
Utilizing KPIs that resonate with your distribution business objectives and market dynamics is vital.
-
Ongoing KPI analysis enhances decision-making and operational fluency.
-
Adapting to consumer trends is essential for distribution strategy success.
-
Leveraging KPI insights ensures a sustained competitive advantage for the distribution company.
Having the right tool to track these KPIs is essential for any business aiming to stay competitive. And that's where Solid Innovation steps in. Our Mobile Sales Systems empower your team to seal deals faster, keep customers happy, and enable efficient tracking of crucial KPIs.
With easy-to-use tools, real-time updates, and full control over inventory, prices, and adjustments, you'll see a significant increase in the productivity of your distribution center. Check out our full software solution!